Noise Comparisons
Self noise plots for Trillium sensors
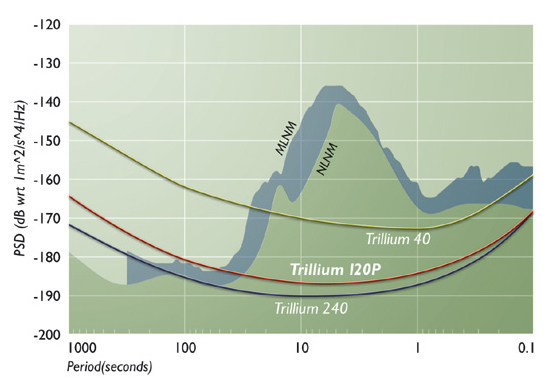
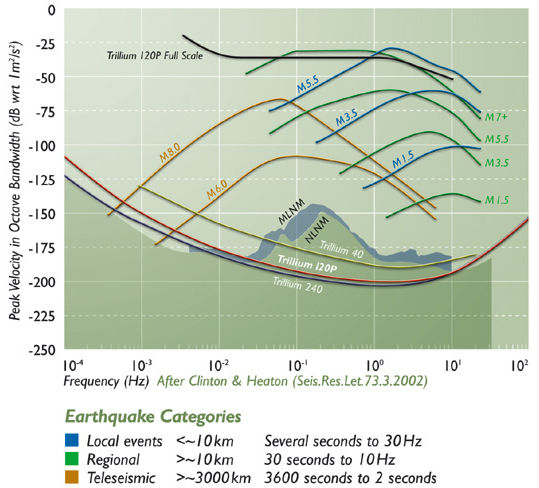
Graphs showing the instrument self noise for Trillium seismometers and instrument performance related to local, regional and teleseismic events
Seismometer self noise for Trillium seismometers relative to the NLNM (after Peterson, 1993) and the MLNM (after McNamara and Buland).
Seismometer self noise and Trillium 120P clip level plotted against the NLNM (after Peterson, 1993), the MLNM (after McNamara and Buland) and typical earthquake spectra for local regional and teleseismic events (after Clinton and Heaton)
Note: Sensor noise floors and earth noise models have been converted to equivalent peak amplitudes using a full octave bandwidth assuming Gaussian distributions and 95% probability.
New Low-Noise Model (NLNM) from Peterson (1993)
Observation and modeling of Seismic Background Noise
PDF Mode Low-Noise Model (MLNM) from McNamara and Buland (2004)
Ambient Noise Levels in the Continental United States
Event Magnitudes from Clinton and Heaton (2002)
Potential Advantages of a Strong Motion Velocity Meter Over a Strong Motion Accelerometer